Questions and Data tracking

Chevy Spark EV Forum

Help Support Chevy Spark EV Forum:

This site may earn a commission from merchant affiliate links, including eBay, Amazon, and others.
Date - Odometer (mi) - kWh - Full charge range (mi)
02/14/19 12464 16.33000 81
03/01/19 12700 16.26670 98
04/23/19 13316 16.20000 108
05/21/19 13692 16.03333 107
06/17/19 14008 16.03333 96
07/12/19 14291 16.29999 93
08/13/19 14827 16.56666 92
09/12/19 15279 16.56666 99
10/09/19 15771 16.73333 108
11/15/19 16293 16.36666 88* (After full preconditioning cycle)
12/09/19 16485 16.20000 97
01/08/20 16905 16.03000 92
02/09/20 17314 15.80000 86
03/04/20 17647 15.80000 96
08/09/20 18098 15.53000 92 (After several months of only partial charges)
10/12/20 18459 15.33000 91
10/31/20 18576 15.13000 86 (Tire pressure had dropped enough that all the tires needed topped off)
01/11/21 18840 14.94000 82
02/04/21 19031 14.47000 78
03/02/21 19208 14.50000 79
04/01/21 19545 14.60000 97
05/03/21 19937 14.47000 97
06/01/21 20322 14.67000 98
07/15/21 20756 14.57000 98
08/09/21 21030 14.63000 92 (Lots of A/C use)
09/03/21 21478 14.73000 96 (Lots of A/C use)
10/01/21 21861 14.67000 99
11/01/21 22229 14.63000 95
12/04/21 22598 14.40000 90
01/05/22 22936 14.33000 77 (Cold weather)
02/02/22 23384 14.13000 77 (Cold weather and lots of remote starts)
03/08/22 23832 13.90000 83

Capacity is dropping but range isn't a concern yet for me. Going back to riding my bike when I can as the weather gets nicer.
 
May 2022 readings

Date - Odometer - Capacity - Range *
05/5/2019 18601 16.1
06/1/2019 18905 15.9
07/3/2019 19259 15.9
08/1/2019 19669 16.3
09/1/2019 19878 16.4
10/2/2019 20190 16.0
11/1/2019 20611 16.0
12/3/2019 20974 15.7
01/1/2020 21176 15.7
02/1/2020 21460 15.4
03/1/2020 21692 15.2
04/1/2020 21951 15.2
05/1/2020 22026 15.2
06/1/2020 22121 15.2
07/1/2020 22248 15.2
08/1/2020 22420 15.2
09/1/2020 22598 15.2
10/3/2020 22828 15.2
11/1/2020 23021 15.2
11/18/2020 23129 13.6 58
12/1/2020 23206 13.6 60
1/1/2021 23299 13.6 56
2/1/2021 23446 13.6 55
2/3/2021 23488 14.0 59
3/1/2021 23616 14.2 58
4/1/2021 23745 14.2 54
5/1/2021 24107 14.4 68
6/1/2021 24332 14.3 67
7/1/2021 24586 14.3 64
8/1/2021 24887 14.3 59
9/1/2021 25044 14.3 61
10/1/2021 25216 14.3 63
11/1/2021 25438 14.3 58
12/1/2021 25759 13.5 58
1/1/2022 25944 13.7 54
2/1/2022 26021 13.7 52
3/1/2022 26179 14.0 54
4/3/2022 26364 14.0 59
5/1/2022 26573 14.0 59
* Distances in miles. Capacity in kWh. Range is on a full charge.

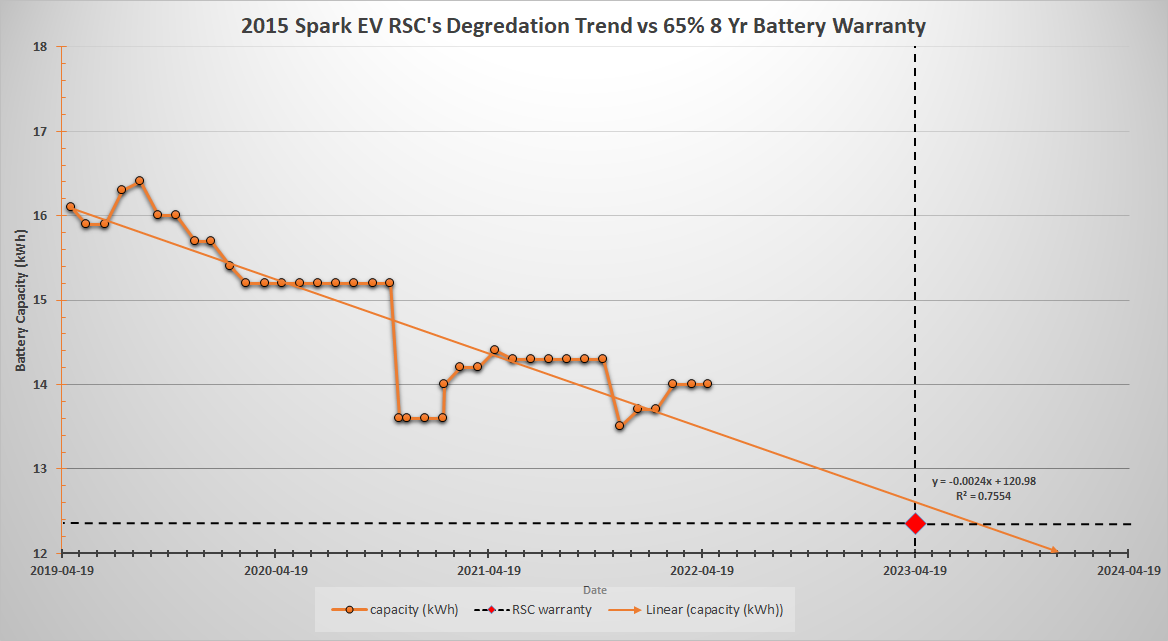
Doesn't look like I'll qualify for warranty replacement. The warranty period for me ends on 4/19/2023. My warranty booklet (2015) says up to 35% degradation. If I assume that my readings are correct and that the initial capacity is 19 kWh, I would have to get down to 12.35 kWh.
 
Date - Odometer (mi) - kWh - Full charge range (mi)
02/14/19 12464 16.33000 81
03/01/19 12700 16.26670 98
04/23/19 13316 16.20000 108
05/21/19 13692 16.03333 107
06/17/19 14008 16.03333 96
07/12/19 14291 16.29999 93
08/13/19 14827 16.56666 92
09/12/19 15279 16.56666 99
10/09/19 15771 16.73333 108
11/15/19 16293 16.36666 88* (After full preconditioning cycle)
12/09/19 16485 16.20000 97
01/08/20 16905 16.03000 92
02/09/20 17314 15.80000 86
03/04/20 17647 15.80000 96
08/09/20 18098 15.53000 92 (After several months of only partial charges)
10/12/20 18459 15.33000 91
10/31/20 18576 15.13000 86 (Tire pressure had dropped enough that all the tires needed topped off)
01/11/21 18840 14.94000 82
02/04/21 19031 14.47000 78
03/02/21 19208 14.50000 79
04/01/21 19545 14.60000 97
05/03/21 19937 14.47000 97
06/01/21 20322 14.67000 98
07/15/21 20756 14.57000 98
08/09/21 21030 14.63000 92 (Lots of A/C use)
09/03/21 21478 14.73000 96 (Lots of A/C use)
10/01/21 21861 14.67000 99
11/01/21 22229 14.63000 95
12/04/21 22598 14.40000 90
01/05/22 22936 14.33000 77 (Cold weather)
02/02/22 23384 14.13000 77 (Cold weather and lots of remote starts)
03/08/22 23832 13.90000 83
04/11/22 24238 13.87000 85
05/02/22 24501 14.03000 90
 
RSC said:
May 2022 readings


Doesn't look like I'll qualify for warranty replacement. The warranty period for me ends on 4/19/2023. My warranty booklet (2015) says up to 35% degradation. If I assume that my readings are correct and that the initial capacity is 19 kWh, I would have to get down to 12.35 kWh.

There are ways you can accelerate or reverse your HV lithium pack's capacity. However, and this is my 2 cents on battery replacement, there isn't a chance the Spark will see out-of-warranty replacement packs bought by owners at a price even 1:1 with the blue book value of the car. OEM is around $1200/kwh after all. So the battery replacement warranty is a pretty important milestone for each Spark if these cars are going to remain on the road and in circulation in the used market for the next decade until capacity drops below that fuzzy real-world threshold of feasible range. Also, hey things are going to get a lot more expensive by the end of this year for a long time. It might just come down to necessity.

Speaking of necessity, if any of you had the choice, would you augment your original battery pack's capacity if you could? If so, would you change your behavior to reach the battery warranty in time? Or would you instead try to rejuvenate cells and reverse the degradation?

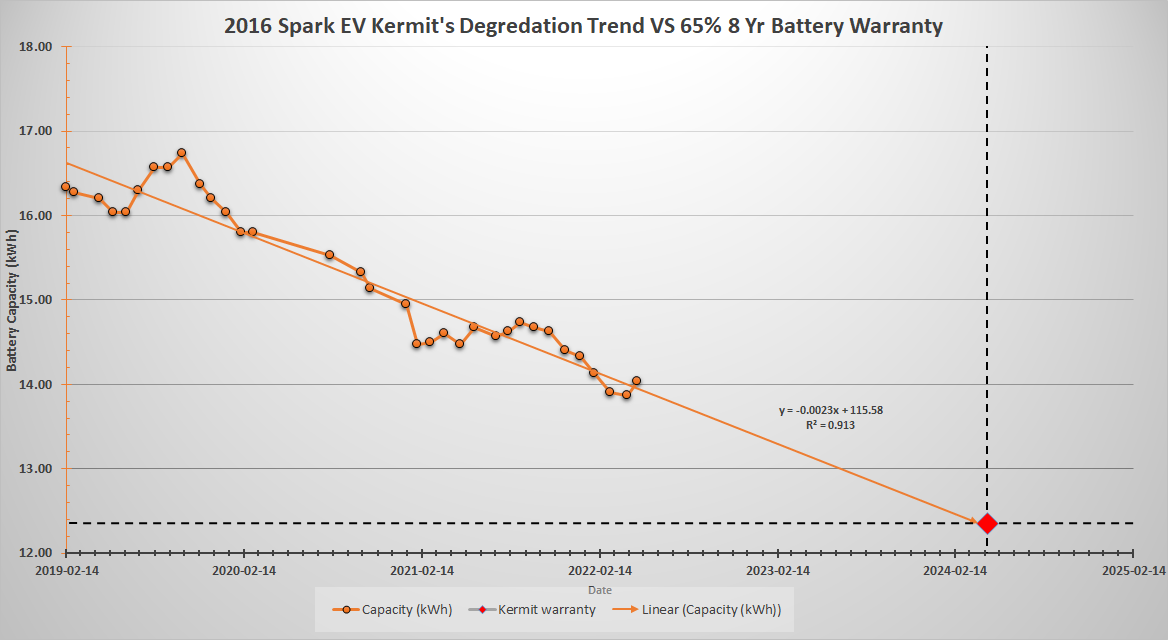
Anyway, onto charts:
Last time I provided an exponential trendline using both your individual degradation data because it had the highest R^2. In other words, it fit the data points best. However, I was skeptical of this extrapolation, so I scouted for some li-ion degradation papers and found this one regarding calendar aging.

https://www.semanticscholar.org/paper/Modeling-of-Lithium-Ion-Battery-Degradation-for-Xu-Oudalov/09b0c41c2f131e1acebd65297799990368cc3cab
If you look at some of the image previews you can see that there is initially an exponential trend in new packs, but the rest of its lifecycle is linear.

Also, Kermit, I wasn't sure what your warranty date was so I just used RSC's 2015 Spark warranty and advanced it by a year since you have a 2016. I can edit this later if you share it.

Also, I removed mileage from both charts. Partly because it didn't seem to be visually demonstrating much while cluttering the plot area, but mostly because Microsoft Excel is limited to a primary and secondary series set of axes and it's impossible to get a scatter plot with X and Y error bars while also retaining a horizontal date range. Excel's charting rules are actually really nuanced and annoying when you start getting into complex charting.


ybfLT41.png


auJYguB.png


Because RSC's R^2 is only a 75% fit, there's a chance we could see another big dip in capacity, like in mid-2020 / '21 and the Spark will make it in time for its replacement warranty with your current behavior, but it would have to be JUST in time, and that's without any lead time for drawn-out correspondence with dealers and GM.

Last point, to use the trendline equation, substitute your battery capacity in kWh for y, and solve for x, the number of days after your first data entry. So if you wanted to know what your capacity will be like in 2030, or when you hit 10 kWh, you could do that.
 
Infinion said:
Speaking of necessity, if any of you had the choice, would you augment your original battery pack's capacity if you could? If so, would you change your behavior to reach the battery warranty in time? Or would you instead try to rejuvenate cells and reverse the degradation?

Thank you for posting these charts. I've been out of town and haven't been able to easily reply.

I know that it would be financially best if it came to that, but I really don't want to go through the warranty process. The local Chevy dealer has a good reputation, they gave me a good price on windshield wiper blades and talked to me at some length about programming another key fob. However, I think they don't yet know much about EVs. Warranty replacement would probably be quite involved, and the current capacity meets my needs just fine. I wouldn't intentionally do anything to degrade the battery to make the warranty.

I would instead try to rejuvenate cells and reverse the degradation. Not because I would use the extra range, but just because I would like to feel that the car is in good shape.
 
Great post Infinion. I believe my car was manufactured in June of 2016 so I'm not sure if the warranty is based on that or on the purchase date. I am the second owner of the car and can't seem to find the carfax I got when I purchased it from Carvana.

As long as the range works for my needs I will continue to drive it. Considering I still usually get over the 82 mile range it's rated for I'm happy. I am aiming to keep this car for about 12 years and hope this will fit my needs for that amount of time.

The local dealer worked on my wife's Volt and replaced the BCM inside the battery pack and they did a great job. I would probably not do any warranty work on the batteries unless it was some sort of recall because the car still meets my needs.

As of now I'm only out a set of wiper blades and the money I spent to add a spare tire, and backup camera.
 
June 2022 readings

Date - Odometer - Capacity - Range *
05/5/2019 18601 16.1
06/1/2019 18905 15.9
07/3/2019 19259 15.9
08/1/2019 19669 16.3
09/1/2019 19878 16.4
10/2/2019 20190 16.0
11/1/2019 20611 16.0
12/3/2019 20974 15.7
01/1/2020 21176 15.7
02/1/2020 21460 15.4
03/1/2020 21692 15.2
04/1/2020 21951 15.2
05/1/2020 22026 15.2
06/1/2020 22121 15.2
07/1/2020 22248 15.2
08/1/2020 22420 15.2
09/1/2020 22598 15.2
10/3/2020 22828 15.2
11/1/2020 23021 15.2
11/18/2020 23129 13.6 58
12/1/2020 23206 13.6 60
1/1/2021 23299 13.6 56
2/1/2021 23446 13.6 55
2/3/2021 23488 14.0 59
3/1/2021 23616 14.2 58
4/1/2021 23745 14.2 54
5/1/2021 24107 14.4 68
6/1/2021 24332 14.3 67
7/1/2021 24586 14.3 64
8/1/2021 24887 14.3 59
9/1/2021 25044 14.3 61
10/1/2021 25216 14.3 63
11/1/2021 25438 14.3 58
12/1/2021 25759 13.5 58
1/1/2022 25944 13.7 54
2/1/2022 26021 13.7 52
3/1/2022 26179 14.0 54
4/3/2022 26364 14.0 59
5/1/2022 26573 14.0 59
6/1/2022 26891 14.2 66

* Distances in miles. Capacity in kWh. Range is on a full charge.

Pretty close to what it was exactly a year ago.
 
Date - Odometer (mi) - kWh - Full charge range (mi)
02/14/19 12464 16.33000 81
03/01/19 12700 16.26670 98
04/23/19 13316 16.20000 108
05/21/19 13692 16.03333 107
06/17/19 14008 16.03333 96
07/12/19 14291 16.29999 93
08/13/19 14827 16.56666 92
09/12/19 15279 16.56666 99
10/09/19 15771 16.73333 108
11/15/19 16293 16.36666 88* (After full preconditioning cycle)
12/09/19 16485 16.20000 97
01/08/20 16905 16.03000 92
02/09/20 17314 15.80000 86
03/04/20 17647 15.80000 96
08/09/20 18098 15.53000 92 (After several months of only partial charges)
10/12/20 18459 15.33000 91
10/31/20 18576 15.13000 86 (Tire pressure had dropped enough that all the tires needed topped off)
01/11/21 18840 14.94000 82
02/04/21 19031 14.47000 78
03/02/21 19208 14.50000 79
04/01/21 19545 14.60000 97
05/03/21 19937 14.47000 97
06/01/21 20322 14.67000 98
07/15/21 20756 14.57000 98
08/09/21 21030 14.63000 92 (Lots of A/C use)
09/03/21 21478 14.73000 96 (Lots of A/C use)
10/01/21 21861 14.67000 99
11/01/21 22229 14.63000 95
12/04/21 22598 14.40000 90
01/05/22 22936 14.33000 77 (Cold weather)
02/02/22 23384 14.13000 77 (Cold weather and lots of remote starts)
03/08/22 23832 13.90000 83
04/11/22 24238 13.87000 85
05/02/22 24501 14.03000 90
06/06/22 24724 14.17000 96
 
July 2022 readings

Date - Odometer - Capacity - Range *
05/5/2019 18601 16.1
06/1/2019 18905 15.9
07/3/2019 19259 15.9
08/1/2019 19669 16.3
09/1/2019 19878 16.4
10/2/2019 20190 16.0
11/1/2019 20611 16.0
12/3/2019 20974 15.7
01/1/2020 21176 15.7
02/1/2020 21460 15.4
03/1/2020 21692 15.2
04/1/2020 21951 15.2
05/1/2020 22026 15.2
06/1/2020 22121 15.2
07/1/2020 22248 15.2
08/1/2020 22420 15.2
09/1/2020 22598 15.2
10/3/2020 22828 15.2
11/1/2020 23021 15.2
11/18/2020 23129 13.6 58
12/1/2020 23206 13.6 60
1/1/2021 23299 13.6 56
2/1/2021 23446 13.6 55
2/3/2021 23488 14.0 59
3/1/2021 23616 14.2 58
4/1/2021 23745 14.2 54
5/1/2021 24107 14.4 68
6/1/2021 24332 14.3 67
7/1/2021 24586 14.3 64
8/1/2021 24887 14.3 59
9/1/2021 25044 14.3 61
10/1/2021 25216 14.3 63
11/1/2021 25438 14.3 58
12/1/2021 25759 13.5 58
1/1/2022 25944 13.7 54
2/1/2022 26021 13.7 52
3/1/2022 26179 14.0 54
4/3/2022 26364 14.0 59
5/1/2022 26573 14.0 59
6/1/2022 26891 14.2 66
7/1/2022 27148 14.2 66

* Distances in miles. Capacity in kWh. Range is on a full charge.

No change from last month.
 
Date - Odometer (mi) - kWh - Full charge range (mi)
02/14/19 12464 16.33000 81
03/01/19 12700 16.26670 98
04/23/19 13316 16.20000 108
05/21/19 13692 16.03333 107
06/17/19 14008 16.03333 96
07/12/19 14291 16.29999 93
08/13/19 14827 16.56666 92
09/12/19 15279 16.56666 99
10/09/19 15771 16.73333 108
11/15/19 16293 16.36666 88* (After full preconditioning cycle)
12/09/19 16485 16.20000 97
01/08/20 16905 16.03000 92
02/09/20 17314 15.80000 86
03/04/20 17647 15.80000 96
08/09/20 18098 15.53000 92 (After several months of only partial charges)
10/12/20 18459 15.33000 91
10/31/20 18576 15.13000 86 (Tire pressure had dropped enough that all the tires needed topped off)
01/11/21 18840 14.94000 82
02/04/21 19031 14.47000 78
03/02/21 19208 14.50000 79
04/01/21 19545 14.60000 97
05/03/21 19937 14.47000 97
06/01/21 20322 14.67000 98
07/15/21 20756 14.57000 98
08/09/21 21030 14.63000 92 (Lots of A/C use)
09/03/21 21478 14.73000 96 (Lots of A/C use)
10/01/21 21861 14.67000 99
11/01/21 22229 14.63000 95
12/04/21 22598 14.40000 90
01/05/22 22936 14.33000 77 (Cold weather)
02/02/22 23384 14.13000 77 (Cold weather and lots of remote starts)
03/08/22 23832 13.90000 83
04/11/22 24238 13.87000 85
05/02/22 24501 14.03000 90
06/06/22 24724 14.17000 96
07/07/22 25214 14.03000 83
 
I haven't followed this thread from the beginning, but the data posted here is interesting to follow and relate to my 2016.

So, what is the source of the Kwh, and mi measures posted here?

If it's TorquePro, which PIDs do you use? (FYI, MyGreenVolt is another app I've used that seems to work just fine with the Spark).

Kermit said:
Date - Odometer (mi) - kWh - Full charge range (mi)
02/14/19 12464 16.33000 81
03/01/19 12700 16.26670 98
[...]
 
For kWh, I'm using Torque Pro with the 2241a3 PID, equation ((A*256)+B)/30. This is courtesy of Sean Graham. Miles on full charge is just from the instrument cluster display.
 
I'm using EngineLink for iOS because it's handy but also have torque pro and the numbers are the same. Mileage is what the guess-o-meter shows me for range after a full charge just like RSC mentioned.
 
Date - Odometer (mi) - kWh - Full charge range (mi)
02/14/19 12464 16.33000 81
03/01/19 12700 16.26670 98
04/23/19 13316 16.20000 108
05/21/19 13692 16.03333 107
06/17/19 14008 16.03333 96
07/12/19 14291 16.29999 93
08/13/19 14827 16.56666 92
09/12/19 15279 16.56666 99
10/09/19 15771 16.73333 108
11/15/19 16293 16.36666 88* (After full preconditioning cycle)
12/09/19 16485 16.20000 97
01/08/20 16905 16.03000 92
02/09/20 17314 15.80000 86
03/04/20 17647 15.80000 96
08/09/20 18098 15.53000 92 (After several months of only partial charges)
10/12/20 18459 15.33000 91
10/31/20 18576 15.13000 86 (Tire pressure had dropped enough that all the tires needed topped off)
01/11/21 18840 14.94000 82
02/04/21 19031 14.47000 78
03/02/21 19208 14.50000 79
04/01/21 19545 14.60000 97
05/03/21 19937 14.47000 97
06/01/21 20322 14.67000 98
07/15/21 20756 14.57000 98
08/09/21 21030 14.63000 92 (Lots of A/C use)
09/03/21 21478 14.73000 96 (Lots of A/C use)
10/01/21 21861 14.67000 99
11/01/21 22229 14.63000 95
12/04/21 22598 14.40000 90
01/05/22 22936 14.33000 77 (Cold weather)
02/02/22 23384 14.13000 77 (Cold weather and lots of remote starts)
03/08/22 23832 13.90000 83
04/11/22 24238 13.87000 85
05/02/22 24501 14.03000 90
06/06/22 24724 14.17000 96
07/07/22 25214 14.03000 83 (Lots of A/C use)
07/31/22 25885 14.07000 88 (Lots of A/C use)
 
September 2022 readings

Date - Odometer - Capacity - Range *
05/5/2019 18601 16.1
06/1/2019 18905 15.9
07/3/2019 19259 15.9
08/1/2019 19669 16.3
09/1/2019 19878 16.4
10/2/2019 20190 16.0
11/1/2019 20611 16.0
12/3/2019 20974 15.7
01/1/2020 21176 15.7
02/1/2020 21460 15.4
03/1/2020 21692 15.2
04/1/2020 21951 15.2
05/1/2020 22026 15.2
06/1/2020 22121 15.2
07/1/2020 22248 15.2
08/1/2020 22420 15.2
09/1/2020 22598 15.2
10/3/2020 22828 15.2
11/1/2020 23021 15.2
11/18/2020 23129 13.6 58
12/1/2020 23206 13.6 60
1/1/2021 23299 13.6 56
2/1/2021 23446 13.6 55
2/3/2021 23488 14.0 59
3/1/2021 23616 14.2 58
4/1/2021 23745 14.2 54
5/1/2021 24107 14.4 68
6/1/2021 24332 14.3 67
7/1/2021 24586 14.3 64
8/1/2021 24887 14.3 59
9/1/2021 25044 14.3 61
10/1/2021 25216 14.3 63
11/1/2021 25438 14.3 58
12/1/2021 25759 13.5 58
1/1/2022 25944 13.7 54
2/1/2022 26021 13.7 52
3/1/2022 26179 14.0 54
4/3/2022 26364 14.0 59
5/1/2022 26573 14.0 59
6/1/2022 26891 14.2 66
7/1/2022 27148 14.2 66
8/1/2022 27396 14.2 62
9/1/2022 27656 14.0 59

* Distances in miles. Capacity in kWh. Range is on a full charge.

Lots of A/C use recently.
 
Date - Odometer (mi) - kWh - Full charge range (mi)
02/14/19 12464 16.33000 81
03/01/19 12700 16.26670 98
04/23/19 13316 16.20000 108
05/21/19 13692 16.03333 107
06/17/19 14008 16.03333 96
07/12/19 14291 16.29999 93
08/13/19 14827 16.56666 92
09/12/19 15279 16.56666 99
10/09/19 15771 16.73333 108
11/15/19 16293 16.36666 88* (After full preconditioning cycle)
12/09/19 16485 16.20000 97
01/08/20 16905 16.03000 92
02/09/20 17314 15.80000 86
03/04/20 17647 15.80000 96
08/09/20 18098 15.53000 92 (After several months of only partial charges)
10/12/20 18459 15.33000 91
10/31/20 18576 15.13000 86 (Tire pressure had dropped enough that all the tires needed topped off)
01/11/21 18840 14.94000 82
02/04/21 19031 14.47000 78
03/02/21 19208 14.50000 79
04/01/21 19545 14.60000 97
05/03/21 19937 14.47000 97
06/01/21 20322 14.67000 98
07/15/21 20756 14.57000 98
08/09/21 21030 14.63000 92 (Lots of A/C use)
09/03/21 21478 14.73000 96 (Lots of A/C use)
10/01/21 21861 14.67000 99
11/01/21 22229 14.63000 95
12/04/21 22598 14.40000 90
01/05/22 22936 14.33000 77 (Cold weather)
02/02/22 23384 14.13000 77 (Cold weather and lots of remote starts)
03/08/22 23832 13.90000 83
04/11/22 24238 13.87000 85
05/02/22 24501 14.03000 90
06/06/22 24724 14.17000 96
07/07/22 25214 14.03000 83 (Lots of A/C use)
07/31/22 25885 14.07000 88 (Lots of A/C use)
09/06/22 25931 14.03000 90
09/29/22 26179 14.00000 92
 
October 2022 readings

Date - Odometer - Capacity - Range *
05/5/2019 18601 16.1
06/1/2019 18905 15.9
07/3/2019 19259 15.9
08/1/2019 19669 16.3
09/1/2019 19878 16.4
10/2/2019 20190 16.0
11/1/2019 20611 16.0
12/3/2019 20974 15.7
01/1/2020 21176 15.7
02/1/2020 21460 15.4
03/1/2020 21692 15.2
04/1/2020 21951 15.2
05/1/2020 22026 15.2
06/1/2020 22121 15.2
07/1/2020 22248 15.2
08/1/2020 22420 15.2
09/1/2020 22598 15.2
10/3/2020 22828 15.2
11/1/2020 23021 15.2
11/18/2020 23129 13.6 58
12/1/2020 23206 13.6 60
1/1/2021 23299 13.6 56
2/1/2021 23446 13.6 55
2/3/2021 23488 14.0 59
3/1/2021 23616 14.2 58
4/1/2021 23745 14.2 54
5/1/2021 24107 14.4 68
6/1/2021 24332 14.3 67
7/1/2021 24586 14.3 64
8/1/2021 24887 14.3 59
9/1/2021 25044 14.3 61
10/1/2021 25216 14.3 63
11/1/2021 25438 14.3 58
12/1/2021 25759 13.5 58
1/1/2022 25944 13.7 54
2/1/2022 26021 13.7 52
3/1/2022 26179 14.0 54
4/3/2022 26364 14.0 59
5/1/2022 26573 14.0 59
6/1/2022 26891 14.2 66
7/1/2022 27148 14.2 66
8/1/2022 27396 14.2 62
9/1/2022 27656 14.0 59
10/1/2022 27901 14.0 55

* Distances in miles. Capacity in kWh. Range is on a full charge.

On Saturday I went to the local Chevy dealer to look at a 2022 Bolt EUV. It was really tempting. Really nice in person.
 
November 2022 readings

Date - Odometer - Capacity - Range *
05/5/2019 18601 16.1
06/1/2019 18905 15.9
07/3/2019 19259 15.9
08/1/2019 19669 16.3
09/1/2019 19878 16.4
10/2/2019 20190 16.0
11/1/2019 20611 16.0
12/3/2019 20974 15.7
01/1/2020 21176 15.7
02/1/2020 21460 15.4
03/1/2020 21692 15.2
04/1/2020 21951 15.2
05/1/2020 22026 15.2
06/1/2020 22121 15.2
07/1/2020 22248 15.2
08/1/2020 22420 15.2
09/1/2020 22598 15.2
10/3/2020 22828 15.2
11/1/2020 23021 15.2
11/18/2020 23129 13.6 58
12/1/2020 23206 13.6 60
1/1/2021 23299 13.6 56
2/1/2021 23446 13.6 55
2/3/2021 23488 14.0 59
3/1/2021 23616 14.2 58
4/1/2021 23745 14.2 54
5/1/2021 24107 14.4 68
6/1/2021 24332 14.3 67
7/1/2021 24586 14.3 64
8/1/2021 24887 14.3 59
9/1/2021 25044 14.3 61
10/1/2021 25216 14.3 63
11/1/2021 25438 14.3 58
12/1/2021 25759 13.5 58
1/1/2022 25944 13.7 54
2/1/2022 26021 13.7 52
3/1/2022 26179 14.0 54
4/3/2022 26364 14.0 59
5/1/2022 26573 14.0 59
6/1/2022 26891 14.2 66
7/1/2022 27148 14.2 66
8/1/2022 27396 14.2 62
9/1/2022 27656 14.0 59
10/1/2022 27901 14.0 55
11/1/2022 28333 14.2 57

* Distances in miles. Capacity in kWh. Range is on a full charge.

Maybe I should be posting in the battery degradation thread.
 
Date - Odometer (mi) - kWh - Full charge range (mi)
02/14/19 12464 16.33000 81
03/01/19 12700 16.26670 98
04/23/19 13316 16.20000 108
05/21/19 13692 16.03333 107
06/17/19 14008 16.03333 96
07/12/19 14291 16.29999 93
08/13/19 14827 16.56666 92
09/12/19 15279 16.56666 99
10/09/19 15771 16.73333 108
11/15/19 16293 16.36666 88* (After full preconditioning cycle)
12/09/19 16485 16.20000 97
01/08/20 16905 16.03000 92
02/09/20 17314 15.80000 86
03/04/20 17647 15.80000 96
08/09/20 18098 15.53000 92 (After several months of only partial charges)
10/12/20 18459 15.33000 91
10/31/20 18576 15.13000 86 (Tire pressure had dropped enough that all the tires needed topped off)
01/11/21 18840 14.94000 82
02/04/21 19031 14.47000 78
03/02/21 19208 14.50000 79
04/01/21 19545 14.60000 97
05/03/21 19937 14.47000 97
06/01/21 20322 14.67000 98
07/15/21 20756 14.57000 98
08/09/21 21030 14.63000 92 (Lots of A/C use)
09/03/21 21478 14.73000 96 (Lots of A/C use)
10/01/21 21861 14.67000 99
11/01/21 22229 14.63000 95
12/04/21 22598 14.40000 90
01/05/22 22936 14.33000 77 (Cold weather)
02/02/22 23384 14.13000 77 (Cold weather and lots of remote starts)
03/08/22 23832 13.90000 83
04/11/22 24238 13.87000 85
05/02/22 24501 14.03000 90
06/06/22 24724 14.17000 96
07/07/22 25214 14.03000 83 (Lots of A/C use)
07/31/22 25885 14.07000 88 (Lots of A/C use)
09/06/22 25931 14.03000 90
09/29/22 26179 14.00000 92
11/01/22 26420 14.10000 87
 
December 2022 readings

Date - Odometer - Capacity - Range *
05/5/2019 18601 16.1
06/1/2019 18905 15.9
07/3/2019 19259 15.9
08/1/2019 19669 16.3
09/1/2019 19878 16.4
10/2/2019 20190 16.0
11/1/2019 20611 16.0
12/3/2019 20974 15.7
01/1/2020 21176 15.7
02/1/2020 21460 15.4
03/1/2020 21692 15.2
04/1/2020 21951 15.2
05/1/2020 22026 15.2
06/1/2020 22121 15.2
07/1/2020 22248 15.2
08/1/2020 22420 15.2
09/1/2020 22598 15.2
10/3/2020 22828 15.2
11/1/2020 23021 15.2
11/18/2020 23129 13.6 58
12/1/2020 23206 13.6 60
1/1/2021 23299 13.6 56
2/1/2021 23446 13.6 55
2/3/2021 23488 14.0 59
3/1/2021 23616 14.2 58
4/1/2021 23745 14.2 54
5/1/2021 24107 14.4 68
6/1/2021 24332 14.3 67
7/1/2021 24586 14.3 64
8/1/2021 24887 14.3 59
9/1/2021 25044 14.3 61
10/1/2021 25216 14.3 63
11/1/2021 25438 14.3 58
12/1/2021 25759 13.5 58
1/1/2022 25944 13.7 54
2/1/2022 26021 13.7 52
3/1/2022 26179 14.0 54
4/3/2022 26364 14.0 59
5/1/2022 26573 14.0 59
6/1/2022 26891 14.2 66
7/1/2022 27148 14.2 66
8/1/2022 27396 14.2 62
9/1/2022 27656 14.0 59
10/1/2022 27901 14.0 55
11/1/2022 28333 14.2 57
12/1/2022 28333 14.2 51

* Distances in miles. Capacity in kWh. Range is on a full charge.

I was surprised to get the monthly OnStar diagnostic report both yesterday, November 30, and on November 1, but no diagnostic report today, December 1.
 
Back
Top