I'd like corroborating evidence on the 19.44 kWh figure, as I don't believe they just had typos and let them continue for 2 years.bro1999 said:MYSTERY SOLVED!! Well, maybe.
I got in contact with one of the moderators on the gm-volt.com forum (he works for GM...probably some kind of engineer), and he told me the 2015 and 2016 Spark EV batteries have 19.44 kWh total energy. He said the press releases of 18.4 and 19 kWh were probably "typos".....so GM never bothered to correct them? Wtf?
He also said under ideal conditions, the battery can exceed 20 kWh under ideal charging conditions.
So assuming the 15/16 Spark batteries have about 18.5 kWh usable, that still means almost 95% of the total battery capacity is utilized.
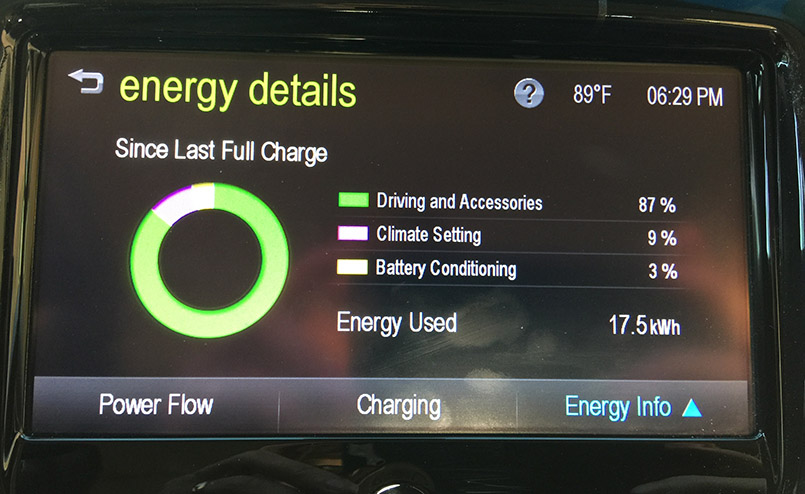
Nevertheless, be skeptical of the "energy details" display data, as it varies day-to-day. I purposefully ran the car to empty this afternoon to get this image. The car was unable to move when I took this picture and the battery was effectively dead. For reference, the car is a '15 with just under 13,000 miles.